Risk Score
Turns complex security data into a live, decision-ready risk score leaders can act on.
Risk is calculated using asset criticality, exposure, and real-world context—not just raw vulnerability counts.
Risk scores automatically adjust as environments, configurations, and dependencies change.
Clear, explainable scoring helps teams prioritize action with confidence across IT, security, and leadership.
See how vulnerabilities, assets, and business impact come together in a single risk signal.

Combines data from assets, vulnerabilities, configurations, and dependencies to produce a unified risk score.

Incorporates asset importance, ownership, and environment sensitivity to distinguish critical risk from background noise..

Automatically reorders risk as conditions change, ensuring teams focus on what matters most right now.

Provides transparency into how scores are calculated, enabling trust, validation, and executive communication.
.svg)
Delivers a shared risk language for security, IT, compliance, and leadership—reducing misalignment.
Connects risk scores directly to affected assets and systems, making remediation paths clear and actionable.
Risk Score aligns technical risk signals with organizational standards and oversight needs—helping teams communicate, prioritize, and defend decisions with confidence.
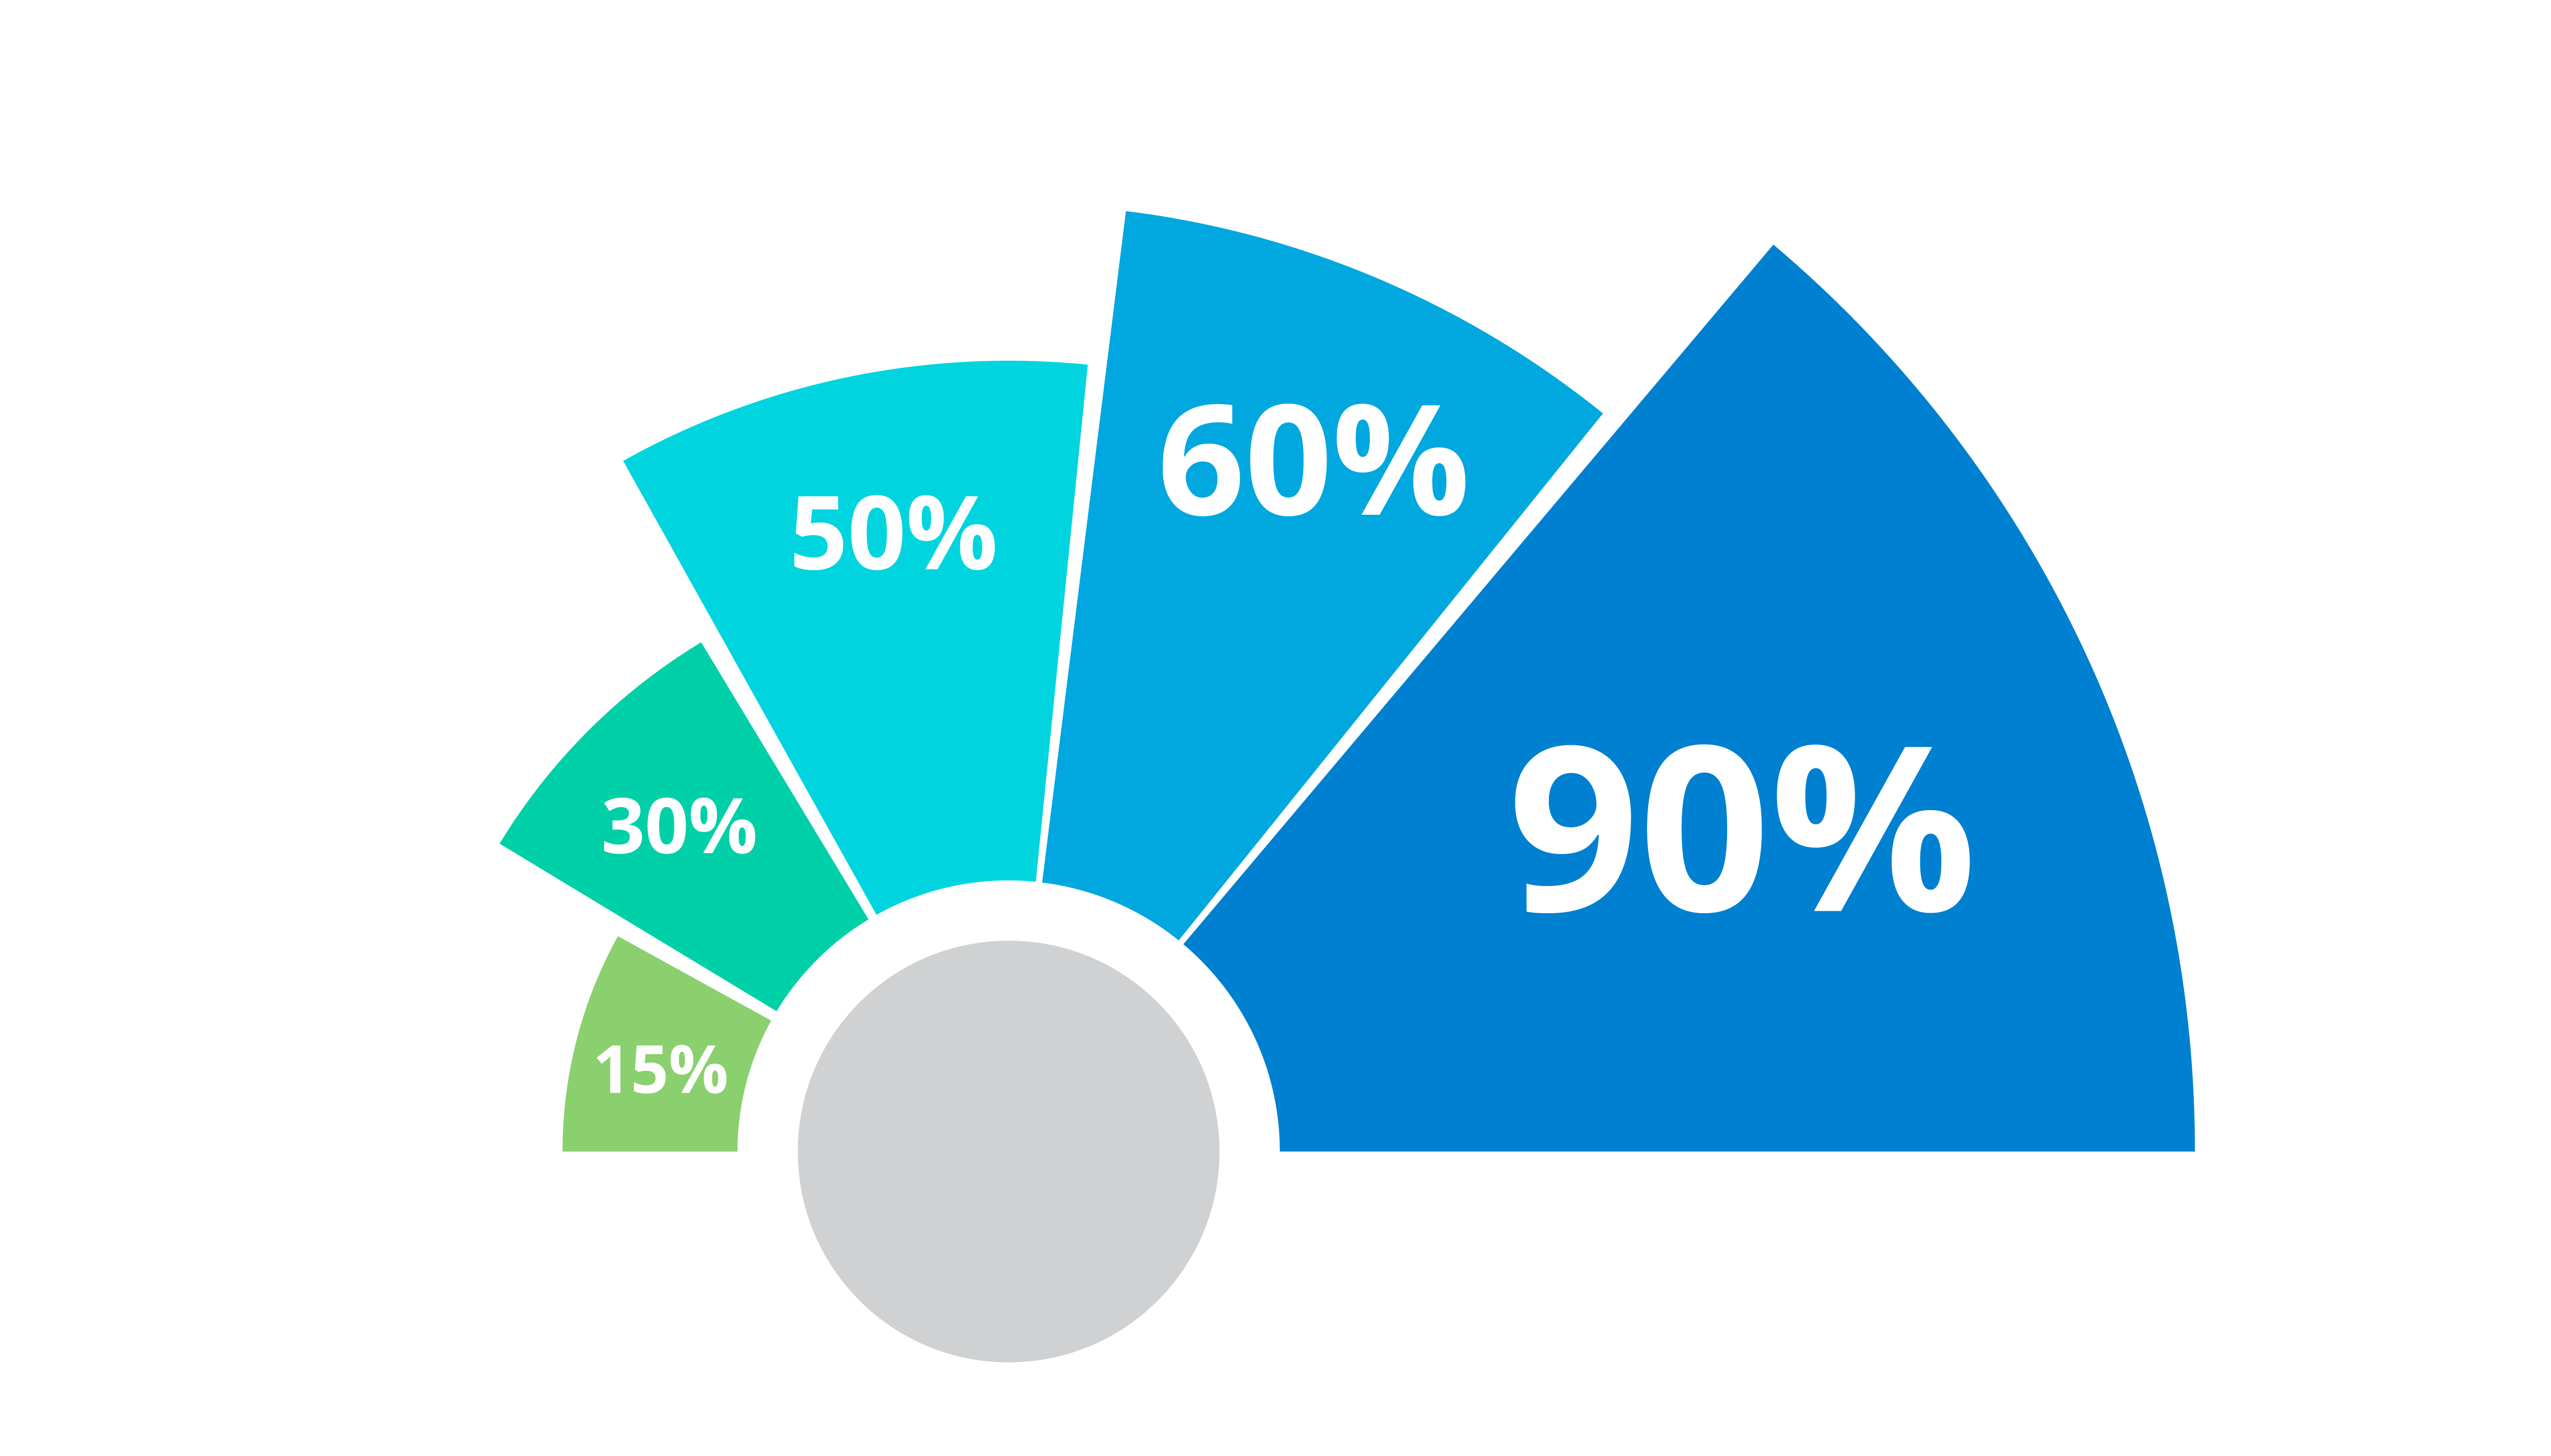
Risk Score translates complex signals into a clear, comparable score that reflects overall security health.
Track overall posture and trends without digging into raw findings.
Understand how operational issues influence overall risk.
Communicate security health with a clear, defensible metric.
Different risk signals reduced to a consistent scale.

Track score movement over time, not just snapshots.

Understand relative posture across teams or environments.
Use the score to guide prioritization and communication.